Integration for Idiots, Appendix A: Everybody is right, but the results are wrong
One of the lingering disputes in various comment threads is "who is correct about the affects of adjacent peaks, Brenna or WM-A?". There are papers, data, testimony and interpretation to support either position.
In an attempt to understand the question, we went back to our spreadsheet and tried some scenarios and found, to our amusement, that they are both correct. The computed result can go either way, and it turns out to be very sensitive to the integration intervals that are selected, either automatically or manually.
What is perhaps more interesting is that it doesn't seem like any selection of intervals results in values that are correct with regards to the true values of the CIRs of two peaks.
For details, read on...
[MORE]
What we did was fire up the spreadsheet, and start with some peaks similar to those in Figure 11. Then we moved them closer and closer together until the results started to be significantly affected. When they were, we noticed the integration looked odd, and corrected it once, and still had odd results.
Then, we tried lots of different integrations, and found all kinds of results, none true.
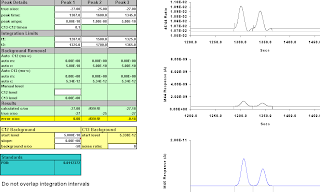
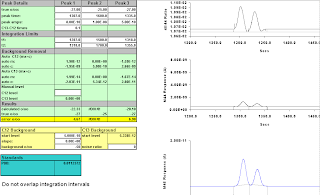
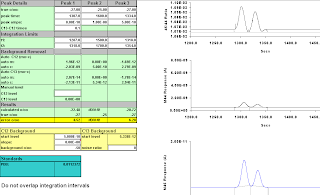
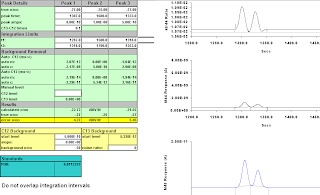
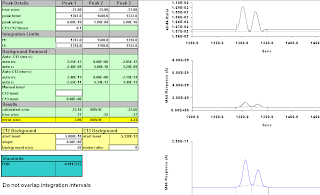
Let's march down this exercise case by case. Click on any image for full-size.
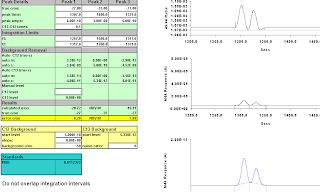
We have two peaks, both at -27.0. In all examples, the ones of interest are "Peak 1" and "Peak 3"; "Peak 2 is offscreen to the right.
We start them so they don't overlap, and establish integration intervals that return correct results.
peaks at 1307 and 1345,
integrate at 1287, 1325, and 1365;
values 027.00 and 027.18.
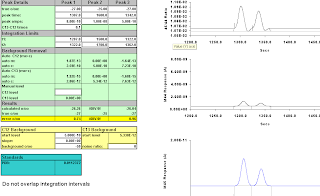
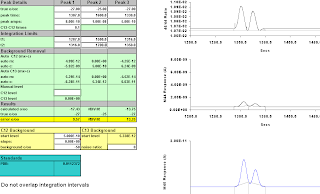
Then we move "Peak 3" one second to the left, and move the integration interval one to the left as well,
Figure A-7: 6 secs; results -23.79, -21.89
Figure A-9: Seven seconds, 1320-1357; -25.17, -24.66
Figure A-10: Eight seconds, 1319-1356; -24.00, -22.84. Results starting to be wacky.
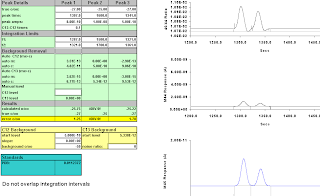
Figure A-11: Nine seconds, 1318-1355; -22.33, -20.10
Figure A-12: Ten seconds, 1318-1354; -22.48, -20.72
Figure A-13: Eleven seconds, 1318-1353; -22.73, -21.55
Figure A-14: Twelve Seconds; 1318-1352; -23.10, -22.66
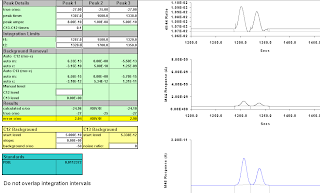
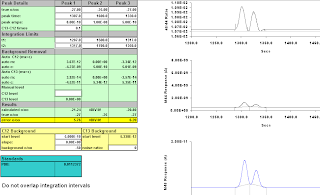
Figure A-15: Thirteen Seconds; 1317-1351; -20.72, -19.11. Wow. Getting really odd!
Figure A-16: Fourteen seconds, 1316-1350; -17.43, -13.75. That's wrong.
integration moved right to 1317-1350;
-21.24; -20.80.
Still wrong, but not obviously so from the 44/45 trace.
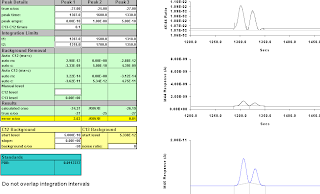
Figure A-19: 14 secs, moved more to the right, 1320-1350; -29.72, -35.96.
It doesn't appear to be very hard to get wrong answers, and impossible to get correct ones when there is enough overlap, and the variation can go either way depending on where you draw your integration points.
This doesn't even begin to consider what might happen with a third peak anywhere in the region.






39 comments:
Holy moly. I like this.
But I don't like Brenna's 1994 data. What is the difference between your spreadsheet and his -for the lack of a better term -his fitting function in that paper? (I tried reading that one for shits and giggles but couldn't make heads or tails of it).
dan
TbV or Ali,
Say you magnify a peak and look really closely at the base. If there is something leading up to the peak on the left side, is there anyway to tell whether it is a separate co-eluting peak, or a "slow beginning" of the peak it is connected to on the right? Like the beginning of the 5bA peak in the F3 GC/MS?
I'm not enough of an expert to know. I suspect anything other than a nice gaussian peak is dubious. I'd probably want some other data to better understand what was going on, like full scan mass-spec data.
It seems to fall into the area of "visually suspicious", but if you knew what else was going on, is either OK or a problem. We do see trails from all the 5bA's into the 5aA's in all the historic studies, so there is something there going on even in the best case. A trick is how you tell if it is the normal pattern from an abnormal one.
TBV
Mingo, which Brenna '94 are you talking about, and where can I see it?
thx,
-dB
MEMO
To: Scientists
From: Lawyers
Re: Appendix A, Integration for Idiots
We very much appreciate your efforts to explain chromatography to us. Unfortunately, we see no place for your science in our legal system at this time. As soon as you have the kinks worked out of this science, please give us a call. You can pick up one of our cards on your way out of the office.
Sorry, we do not validate parking.
Have a nice day.
Everyone -
I've slept on the question of what happens when peaks overlap, as illuminated by TBV and Ali.
I think we need to focus on the area of the graph described by the peak overlap. Within this tightly bounded space, the chromatographic conditions create an area of high quantum flux, where Heisenberg's famous "uncertainty" principle is replaced by a more fundamental "your guess is as good as mine" principle. This creates a localized yet trippy effect, where black matter actually turns colors, the groundhog sees his shadow and water drains counter-clockwise even in the northern hemisphere. The more severe distortions in data noted by Ali are best explained by the creation within the IRMS of mini black holes that are too small to generate much Hawking radiation, but were large enough to erase LNDD's hard drives and created sonic conditions that caused bottles of whiteout to explode in the vicinity of Claire Frelat's lab paperwork.
I'm not a scientist, so I could be wrong about some of this, and I am open to other explanations.
Ah, yes, the YGIAGAM principle. Know it well. Dr. Brenna said much the same thing in his 1994 study of peak overlap:
"Traditional chromatograms may be thought of as a collection of well-resolved singlets with a few doublets of varying degrees of overlap. The recovery of information from doublets is the subject of this work. It is assumed that triplets and higher multiplets, although rare according to theoretical considerations, will be resolved chromatographically."
So, if we have a triplet, as we do in the F3 GCMS chromatogram for 5bA, it's YGIAGAM, and you have to do the separation over again and try to get better peaks.
Seems he forgot about this back in May.
syi
Larry,
Re-spect ! ...
Ali
Ali, actually I was going to propose a more elegant explanation involving string theory and sun spots. My thinking is, if string theory can reconcile quantum mechanics and general relativity, it might be up to the more difficult task of reconciling Brenna and Dr. M-A. However, I read the Microsoft shrink-wrap license, and it turns out that Excel is not warranted to make correct calculations in 23 dimensional space-time.
Also, string theory could not explain the whiteout on Claire Frelat's lab reports.
Seriously now, there is a nascent "Exceptionally simple theory of Everything" being presented based on mapping particles on an E-8 structure, predicting new ones that may illuminate gravity. Sounds a lot better than string theory to me.
Surfer dude stuns physicists with theory of Everything.
I do not make this shit up.
TBV
Larry,
Too much and too clever. You're starting to scare me now. The first dose was exceptional ... any more and I might develop a dependancy.
TBV,
Please, don't encourage this sort of intelligent humor by adding to it. We're still in the mire of LNDD and WADA. There's something just wrong about mixing brilliance with mire.
Ali,
You last name wouldn't be "G", would it? ;-)
Larry,
Actually, I think that general relativity is more than enough to explain all of this. Whatever results you get in the lab, the interpretation of the data is generally relative to what you want those results to mean.
Then again, it could be that complexity theory and chaos theory are better explanations for all of this. Of course, the "chaos" should really be spelled "KAOS" as in the old "Get Smart" TV shows. :-)
TBV,
That was a very interesting article you linked to.
Daniel m,
Is it because I is Scottish ?
Ali
Larry +1.
Hey Ali and TbV, have you guys been thinking that the peaks in these chromatograms are Gaussian? It seems like all your visual examples were normal distribution, but I could be wrong.
I first noticed in drawing straight lines down from the tip of each peak to the x-axis, that much more of the peak was to the left of the line. Then I read in Brenna 94 that:
"Chromatographic elution profiles previously have been modeled as a Gaussian distribution. Under real chromatographic conditions, peaks are often skewed and not modeled
well by symmetric functions such as a Gaussian. Peak models that take asymmetry into account improve accuracy and precision relative to symmetric model. The exponentially modified Gaussian (EMG) function, a mathematical convolution of a Gaussian with an exponential decay, has proven to be an acceptable model for real (asymmetric) chromatographic peaks, especially when extra column effects are present."
Does your I3 model account for this?
syi
Nope. If anything, the I3 penalizes an exponential decay by calling it a "tail" that gets a point.
Similarly, I don't believe the spreadsheet is of any use for getting meaningful numbers. It illustrates concepts, but is not accurate at a fine level of detail.
Now, remember, Brenna is talking about reverse-fitting generated curves on your real data to try to reconstruct the truth. As WMA noted, nobody does this in practice, even now, 13 years after publication.
TBV
Ali (G?),
Me thought u wuz from Staines.
- Rant
I have a couple of idiot's questions about chromatography, not sure where to post them.
1. I understand that the height of a GC/MS peak depends on the mass/charge ratio of the ion being measured by that peak. I also understand that most ions will have a negative charge of -1 (one electron missing), but some will have a negative charge of -2 (two electrons missing). I further understand, the math here being relatively simple, that all other things being equal, the peak of an ion with a negative charge of -1 will appear twice as high as a peak for an ion with a negative charge of -2. Assuming I understand all this correctly ... do particular ions have known and predictable negative charges? For example, do we know that ion x always has a negative charge of -1 and that ion y always has a negative charge of -2? If so, how can I find out the characteristic negative charge of the ions at issue in the FL case?
2. For GC/IRMS peaks, I understand that the height of the peak depends on the quantity of carbon in each ion that was converted to CO2. So, the height of a peak for a particular ion on a GC/IRMS graph is a factor of the amount of the ion present in the mix, and the number of carbon atoms in the ion. I also remember reading something about 19 carbon atoms being characteristing for these ions. Is this true? If so, then (since it's 19 carbon atoms for each ion), does the height of a GC/IRMS peak accurately reflect the amount of the ion present in the mix?
I'll add another question here, and TBV, if this is not the right place for these questions, maybe you can find a place for them.
From the discussions here about specificity, I had assumed (maybe incorrectly) that LNDD had performed a full mass spectra on FL's S17 samples, but that the data from this mass spectra was lost when LNDD erased its hard drives. Do we have proof that this is what happened? I can find nothing in the testimony or the final decision that discusses the full mass spectra or its fate within LNDD.
Now, it's likely that I don't fully understand what goes on with mass spectra data. There appears to be something called "full" mass spectra, which I understand to be something like a wide-angle view of everything in the sample, and then there's also mass spectra data that can be used to identify individual peaks. I've seen references in the testimony to mass spectra data, but it appears to be data used to identify particular peaks, not the "wide angle" data you'd need to determine specificity.
I'm trying to do the legal analysis of rule 5.4.4.2.1, but I do need to understand and explain the science (on a basic level) as background for the legal discussion. I'd appreciate any help I can get!
Larry, this is as good a place as any to ask.
I can't answer the earlier questions about details of the sensors. My understanding is that the IRMS peaks are proportional in size to the "number of carbon equivalents", which I read to be the number of carbons in the things that are the result of the ionization that lets them hit the 44 and 45 sensors.
As to your second question post, I don't have the hard cites, and got lost in my correspondence diggression when I went looking.
Landis had statements and press conferences when this happened, check the 'primary documents' as I may not get to them fast enough for you.
There are two modes for MS, "full scan" and "selected ion monitoring". When you see 44/45, it is the latter, SIM.
See for example, Ex.88 LNDD 1093, where "SIM" is the MS mode.
I don't see an equivalent page, but on USADA 304/305 we see scan and plot low mass = 50 and high mass=550, which looks like a full-scan to me. But we're shown no plots that cover those scales in the collection that follows.
BTW, on identification, USADA 323 discusses claims of meeting TD2003IDCR +/- 1% or 0.2 minutes, but only computes them for the GC/MS, never the IRMS.
The place where the identifications are first made is on USADA 351, where the tables offer tr (retention time) and trr (relative retention time) for 5bA, 5aA, and 5bP.
TBV
The main reference to deleted files is this Landis release, which is rather shrill, and doesn't clearly identify mass-spec data. I probably heard that from reliable sources, but don't have a cite.
TBV
TBV, on RTs and RRTs, I don't think LNDD ever claimed to have identified IRMS peaks by RTs or RRTs. It's obvious that they used RTs to identify GC/MS peaks, or at least to confirm identifications made in another way (for example, by reference to the mass spectra). I think that every time Brenna, Mongongu et. al. ever referred to RTs or RRTs, this was all they meant - GC/MS to GC/MS comparisons. It does not seem to have occurred to anyone (at least, not until Dr. M-A testified) that they might need a method for identifying IRMS peaks. You can read the testimony or the USADA pre-trial briefs, but I don't think anyone claimed that they were identifying IRMS peaks by using RTs.
Yes, you're right, the Landis press release does not refer to mass spectra data, it seems to focus on missing IRMS data.
USADA 351 does specify RTs and RRTs but does not seem to do so on a comparative basis to any standard like USADA 323. I guess that Dr. M-A used USADA 351 and other reports like it to make his calculations on RRTs between the GC/MS and the IRMS. USADA 323 is a form that clearly contemplates TD2003IDCR; there's nothing comparable I've seen on the IRMS side.
I think that LNDD's criteria for identifying IRMS peaks is the "what else could it be" technique that you and others have mentioned before (of course, you've never said that this rose to the level of "criteria"). When I finish the analysis on specificity, my next trick will be to see if it's possible to describe criteria for the pattern-matching described by Brenna. I know that you did some of this earlier, with your photoshopped charts with the yellow highligher marks, but I'm thinking of something closer to the criteria the labs are using to read EPO tests. In any event, I DO need to figure out if there's any systematic way to adjust peak heights in the GC/MS or the GC/IRMS so that they can be compared. If we're going to do the "here's a big peak, here's a medium peak" thing that Brenna described, we have to have a good way to compare peak sizes.
I found the following on Wikipedia, and I'm officially dropping the question I asked about GC/MS peak heights:
"The y-axis of a mass spectrum represents signal intensity of the ions. In most forms of mass spectrometry, the intensity of ion current measured by the spectrometer does not accurately represent relative abundance, but correlates loosely with it. Therefore it is common to label the y-axis with "arbitrary units". Signal intensity may be dependent on many factors, especially the nature of the molecules being analyzed and how they ionize. On the detection side there are many factors that can also affect signal intensity in a non-proportional way. The size of the ion will affect the velocity of impact and with certain detectors the velocity is proportional to the signal output. In other detection systems, such as FTICR, the number of charges on the ion are more important to signal intensity. In order to make conclusions about relative intensity a great deal of knowledge and care is required."
So, peak heights on a GC/MS don't seem to indicate how much "stuff" there is in the peak. I'm still curious about the meaning of peak heights on a GC/IRMS. If the height of a peak on a GC/MS should be proportional to the height of a peak on a GC/IRMS, then it should still be possible to pattern-match like Dr. Brenna said.
TBV -
You wrote: "I don't see an equivalent page, but on USADA 304/305 we see scan and plot low mass = 50 and high mass=550, which looks like a full-scan to me. But we're shown no plots that cover those scales in the collection that follows."
I think the plot that covers this scan is at USADA 327. This appears to be a full scan used to test the machine - it certainly doesn't look like a full scan of a real substance.
I'm coming to the conclusion that LNDD never performed a full scan mass spectra on FL's S17 samples. I just can't find any evidence that they did. There's evidence in the testimony that LNDD performed SIM mass spectra tests, but not full scan mass spectra tests. Or at least that's how it looks to me.
I'm only looking at the documentation of the S17 testing, by the way - LNDD may have done a full scan mass spectra when they tested FL's other samples, but I'm limiting my investigation at the moment to S17.
If anyone listening wants to dispute my conclusion here, PLEASE do so. I'm working on a legal analysis of the specificity issues, and it would be very helpful to me to have my mistakes pointed out to me as early in this process as possible!
Larry, as you know, most of us have believed all along that they didn't collect, or lost, or destroyed, the complete mass spec data. Even people like OMJ have complained about that, even after the hearing.
The only argument I have seen against that was offered by SundayMorning on DPF who pointed out that the experts seem to have seen something that the rest of us didn't see, although I'm not sure he's right about that.
Also, it does seem a bit weird that Floyd's people didn't make a big fuss about this at the hearing, except for M-A's "But how would they know? Divine intervention?" type comments. But (as with the dexa' and methyl' theory) there may have been reasons for them not to pursue it.
Can't wait to see your position on this. I think 5.4.4.2.1 Specificity is a great lead, but of course you have to get past the "this only applies to the process" argument. Practically that doesn't make any sense to me, but I don't know about legally. Duckstrap argued months and months ago that the TD required the complete mass spec info, so perhaps it would be helpful to get some input from him about why that is necessary scientifically.
syi
Larry, Swim,
I'm not there yet. I look at USADA 305/306 as saying they collected mass 50-500, and that USADA 306 says the MAN_52M parameters were used on all the fractions.
Now, maybe the files weren't saved, or were saved but deleted, and/or never looked at, but it looks to me like the MAN52M does scan that way.
I don't think USADA 327 is relevant at all; it's a Cal run, as Larry suggests. I think it matches USADA 329, which is the MAN41 method file, so they may not be related -- yet USADA 329 says it is doing SIM on ions 44,45 and 46, so I am quite probably confused about something.
There are questions why they'd include the full-scan for the Cal, but not the sample and blank runs.
TBV
Larry,
The mass spectra for the analytes is shown at usada 312. This is the mass spectra for the f1 fraction or 11-keto. If you notice there is mass spectra for all the analytes except for the 11 keto, which is shown as a peak. I suspect these are partial mass spectra, because the probably on cover a certain range.
You also messed up on your GCMS peak heights. The Wikipedia you quote is for the mass spectra, not the ion chromatographs. If you go back and look as GCMS you will note that the GC is hooked up to both a ion detector and a mass spectrometer.
So for the ion chromatographs peak heights are proportional to the amount of the analyte, and the peak patterns are the same so long as the chromatographic conditions are identical, or close enough (my take).
"Qualitative analysis:
Generally chromatographic data is presented as a graph of detector response (y-axis) against retention time (x-axis). This provides a spectrum of peaks for a sample representing the analytes present in a sample eluting from the column at different times. Retention time can be used to identify analytes if the method conditions are constant. Also, the pattern of peaks will be constant for a sample under constant conditions and can identify complex mixtures of analytes. In most modern applications however the GC is connected to a mass spectrometer or similar detector that is capable of identifying the analytes represented by the peaks.
Quantitive analysis:
The area under a peak is proportional to the amount of analyte present. By calculating the area of the peak using the mathematical function of integration, the concentration of an analyte in the original sample can be determined. "
M, if I've screwed up, it won't be the last time. I'll check out what you've posted and write back.
SYI, I guess I missed the memo, I thought it was generally assumed that LNDD had performed a full scan mass spectra and that the data had gotten lost. As for M-A's divine intervention comment, I thought he was talking about SIM mass spectra (peak identification). I may have the science here badly confused, which does not bode well for the dozen or so pages I've written for part I of the specificity analysis.
TBV, I'll go along with whatever the science guys tell me, but I still don't think that USADA 304/305 is much proof of the performance of a full scan mass spectra.
I linked USADA 304/305 to USADA 327because these documents have matching m/z ranges. But on closer examination, I think USADA 304/305 sets forth general settings for the GC/MS machine, and does not provide settings for a particular test. So I was probably wrong to connect USADA 304/305 to the mass spectra at USADA 327. This being the case, I won't think about USADA 329 (which appears to me to be connected to the GC/IRMS testing ...)
You might want to compare USADA 304/305 to the top 2/3 of USADA 267, which are the corresponding MS Acquisition Parameters for the "A" sample. Strangely enough, the "A" sample parameters don't follow the same format as the "B" sample parameters on USADA 304/305. Also, there are no references on USADA 267 to a m/z range. So if USADA 304/305 is proof that LNDD did a full scan mass spectra on the "B" sample, then it would appear that they did the full scan mass spectra only on the "B" sample and not on the "A" sample, which makes no sense to me.
I've now reached the part in this post where I risk looking really, really stupid. In my studies for the writing of the specificity article, I haven't paid any attention to the T/E analysis in the FL case. So it isn't clear to me whether the chromatograms for the T/E analysis might require something like a full scan as opposed to the SIM chromatograms I'm used to looking at. Could this be the reason why USADA 304/305 specifies such a wide range in m/z?
Larry,
And my response to the argument that the chromatography was so poor that no reliable results could be obtained: i.e. noise, sloping baselines, peak separation, shoulders, preceding or trailing peaks.
1. All this stuff is a question of degree. Just because you have a shoulder doesn't mean the peaks are polluted.
2. Meier's testimony was purely qualitative, with lots of pretty graphs. He gave no numerical cut-offs or qualitative signposts so that we could determine when a shoulder etc. might change results. He just waved his hands and said we can't be sure. He gave no authorities for his qualitative statements. We had to take his word about very general qualitative statements. We saw how he misstated things wrt to retention times and the internal standard, hyperbole "divine intervention". His credibility isn't very good.
3. The only time he spoke with specificity was with respect to the mini peak between the 5A and 5B in the F3 sample. He claimed, based on a Brenna research article, that the delta for the following 5A peak would be biased negatively by a preceding mini peak. He gave no reasoning for this. Brenna rebutted this. He drew a diagram. He explained that his results were based on empirical results not just theory.
4. But for me the most persuasive evidence is to compare the Shackelton figure 3 GC-IRMS, showing the 5A and 5B, and the Landis F3 GC-IRMS (usada 349). They are nearly identical wrt to the four central peaks. They both have the mini peak between the 5A and the 5B; they both have shoulders; they both have noise and elevated baselines.
But we know that the Shackelton peaks were pure because it was the pioneering study and peer reviewed. So we know that the 5A and 5B peaks in the Landis F3 are similarly pure.
Shackleton Figure 3.
http://bp3.blogger.com/_xX3hgPBOgag
/RzOBE-rfVVI/AAAAAAAAA14/qJhJv02ypJ4
/s1600-h/shack-fig3.png
Landis F3 GC-IRMS usada 349.
http://ia331326.us.archive.org/1/items
/Floyd_Landis_2006_Doping_Case_Documents8
/USADA_349.pdf
Correction,
The mini peak in the Landis F3 was on the GC-MS chromatogram. It had blended in to the slope in the GC-IRMS.
M, I have no idea why you addressed your 10:32 PM post to me, though I suppose I should be flattered. I did suggest a possible explanation for why overlapping peaks might resolve in a particular way, but when Ali posted this Appendix A, I retracted everything I wrote. I've pretty much decided that whether a chromatogram is "good" or "bad" is a matter of opinion where reasonable minds can differ, and I don't know whether it's possible to say anything more about it. So I agree with your point 1.
I figure it's possible to find a reasonable mind that would differ with your points 2-4. Which would cause me to return to your point 1.
You're right that the stuff I posted about peak heights was written about mass spectra peak heights. So it may not apply to peak heights in chromatograms. It would make sense that chromatograms would have the ability to at least measure ion volumes relative to each other, or else how could you do a T/E ratio test? But I DO remember reading something about peak heights not always being comparable. In any event, I'm supposed to be focusing on specificity now.
Yes, the graphs you cited on USADA 312 are probably mass spectra of individual metabolites. I'd want to know what the x-axis represents in these graphs -- I thought they represented time when I first looked, but now I think not. In any event, I'm searching the record for evidence that LNDD performed a full scan mass spectra, and I'm coming to doubt that they did. Any thoughts?
M- earlier you said:
"But we know that the Shackelton peaks were pure because it was the pioneering study and peer reviewed. So we know that the 5A and 5B peaks in the Landis F3 are similarly pure."
Talk about faith. Shackelton's use of figure 3 was merely used to show the differnce between separation on a DB1 column (upper panel) and a DB 17 column (lower panel). It makes no claims that the peak in between them does not affect the results.
They could have: Look at Table one (page 384) of the same article -5aA mysteriously measuring more negative than 5bA. Similarly, in Aguilera 2001, the other pioneering study, Table one (page 295), mean 5aA measuring more negative than mean 5bA. I appreciate these differences more now in the context of overlapping peaks.
Hmmmmmm. We're talking about two closely related metabolites -what's up with the significant differences- problem with the methodology perhaps?
Being a pioneering study and being peer reviewed is obviously a great first step but does not save one from future reconsideration and questioning -in this case -why the significant differnences between 5bA and 5aA?
Maybe I don't really have all this mass spectra issue nailed down yet, but here is what I understand to be the case.
LNDD did collect mass spectra data on the metabolites of interest - that is, they did identify in the GCMS that they were measuring 5aA and 5bA, etc. But they did not run complete mass spectra of the peaks, which would have shown them that there was ONLY 5aA and 5bA in those peaks.
Now that I write it, that doesn't seem quite right, but there is a difference between knowing that there is 5aA in there, and knowing that there is ONLY 5aA in there.
syi
Mike -
You raise an interesting point, one I have not seen discussed before.
In the discussion that follows, just because I'm using science-y terms doesn't mean I'm pretending to know more than I know.
Yes, it appears that LNDD collected mass spectra data on the metabolites of interest to them. From my understanding, this required LNDD to take mass spectra in limited m/z (mass/charge) scan ranges, rather than doing a full scan across the m/z spectrum. I think this is selective ion monitoring (SIM), not full scan monitoring.
If the SIM mass spectra charts are "pure" (i.e., no contamination, a single molecular "fingerprint"), does that mean that the sample is pure? I don't think so. I think the SIM mass spectra graphs could appear pure even if the sample was contaminated (not "pure"), because the selective ion monitoring might filter out the contamination.
But that's not the interesting question, at least not to me. If the SIM mass spectra checks out as pure for substance x, then when we do a selected ion chromatogram to measure substance x, have we effectively eliminated the possibility that other substances might interfere with our readings on substance x?
My guess is that the answer to this question is "no", or else Duckworth, OMJ and others would not think that specificity is the big unaddressed issue in the FL case. However, now that you've made me think of it, taking SIM chromatograms must be a helpful technique in achieving specificity, even if you cannot use this technique to determine if you actually achieved specificity in any given case.
I don't understand all of this and I'm not expert at any of this, so all comments are welcome.
Exactly. The SIM tells you you do have what you expect in that peak, but does not tell you if you have something else as well.
That is, it will tell you yes, you have baseballs in that bucket, but not whether you also have meatballs.
Now, when you feed that bucket into the IRMS, if you assume you have only baseballs, you might be greatly confused if you get a reading with a very high fat count.
TBV
Mingo,
"Talk about faith. Shackelton's use of figure 3 was merely used to show the differnce between separation on a DB1 column (upper panel) and a DB 17 column (lower panel). It makes no claims that the peak in between them does not affect the results.
They could have: Look at Table one (page 384) of the same article -5aA mysteriously measuring more negative than 5bA. Similarly, in Aguilera 2001, the other pioneering study, Table one (page 295), mean 5aA measuring more negative than mean 5bA. I appreciate these differences more now in the context of overlapping peaks."
You are wrong.
Figure 3 shows that Shackleton obtained peak separation for the 5A and 5B. From that he was able to calculate the carbon values. So his chromatography was adequate to obtain accurate carbon values, and correspondingly LNND's chromatography was adequate to obtain adequate carbon values.
AS to the 5A being more negative than the 5B in the Shackleton and Aguillera research, that was exactly what LNND showed for the Landis F3. It was only Amory who claimed that the 5A and 5B must move in tandem. Shackleton and the Cologne study showed that this was not true.
Larry,
I didn't read your humorous comments to have abandoned your prior arguments wrt the chromatography.
M-
Regarding:
"AS to the 5A being more negative than the 5B in the Shackleton and Aguillera research, that was exactly what LNND showed for the Landis F3. It was only Amory who claimed that the 5A and 5B must move in tandem. Shackleton and the Cologne study showed that this was not true."
Perhaps I was not clear, but I am not mistaken, and there is certainly room for your sentiments above. I'll go backwards, starting with this quote from Aguilera 2001:
"In the present study, the mean
Thanks for the notice TBV. Once again...
M-
Regarding:
"AS to the 5A being more negative than the 5B in the Shackleton and Aguillera research, that was exactly what LNND showed for the Landis F3. It was only Amory who claimed that the 5A and 5B must move in tandem. Shackleton and the Cologne study showed that this was not true."
Perhaps I was not clear, but I am not mistaken, and there is certainly room for your sentiments above. I'll go backwards, starting with this quote from Aguilera 2001:
"In the present study, the mean
Thanks for the notice TBV. And again without the PDF mistranslated characters that truncate the post somehow...
M-
Regarding:
"AS to the 5A being more negative than the 5B in the Shackleton and Aguillera research, that was exactly what LNND showed for the Landis F3. It was only Amory who claimed that the 5A and 5B must move in tandem. Shackleton and the Cologne study showed that this was not true."
Perhaps I was not clear, but I am not mistaken, and there is certainly room for your sentiments above. I'll go backwards, starting with this quote from Aguilera 2001:
"In the present study, the mean delta 13C values for 5aA (26.35‰) and 5bA (25.69‰) in the control group were different (P<0.001), whereas in our previous study with only 10 subjects, we did not observe such a difference (15). In addition, it appears from the data in Table 5 of the present study and from Table 1 in our previous study (15 ) that testosterone administration may decrease 5aA
more than it decreases 5bA. This difference occurs despite the fact that the percentage of conversion of a tracer dose of [14C]testosterone to 5b-androstane-3,17-diol (3.2%) is greater than the percentage of conversion to 5a-andro-
stane-3,17-diol (1.2%) (18). Urinary 5a-androstane-3,17-diol is known to arise from both hepatic and peripheral metabolism, whereas urinary 5b-androstane-3-17-diol is considered to arise only from hepatic metabolism (19). After pharmaceutical doses of testosterone, 5aA may decrease more than 5bA because peripheral
paths to 5a-androstane-3,17-diol are favored. However, there is also a path from dehydroepiandrosterone sulfate to 5b-androstane-3,17-diol that does not pass
through testosterone (20). Utilization of this path could explain why 5bA is higher than 5aA. Finally, the observed differences may be an analytical artifact. Similarly, the higher mean delta13C value for 5bP (24.26‰) might be related to metabolism or artifacts."
What are my points here?
1) Differences in 5aA and 5bA in Aguilera's 2001 study of 73 medical student controls may be analytical artifact, in his own words.
2) This analytical artifact possibility has yet to be investigated further.
3) For this, I am not interested in how 5aA and 5bA change in response to testosterone. I am interested in how these are different in control patients not on testosterone, since in theory, these should have similar carbon 13 contents. If we are measuring a difference, may be our measuring is not a good as we think.
Regarding Shackelton you said:
"So his chromatography was adequate to obtain accurate carbon values, and correspondingly LNND's chromatography was adequate to obtain adequate carbon value"
My point is that accurate carbon values do not guarantee correct carbon values. But don't trust me, Shackelton states on pate 385 of his article:
"Because we know that the reproducibility of delta C13 measurements in duplicate GC/C/IRMS runs is excellent, we must assume that the measured delta C13 values for individual chromatographic peaks are accurate. If these are accurate, then any difference in the value from the "true" value for the steroid determined must represent some minor contamination of the steroid peak by components with greater or less delta C13 values."
He is actually describing the above w/regard to the irreproducibility in 5bP measurements in his study, but the same holds true for the difference in 5aA and 5bA delta C13 measurements in Aguilera's control subjects.
One can wonder how these analytical artifacts might be exaggerated in less than perfect, busy application settings like LNDD, compared with the investigative work of Aguilera.
Thanks,
Dan
Mingo,
Sorry, I really don't understand what you are saying, or what your point is.
Does anything you state discredit the IRMS test results, and if so how?
Post a Comment