The LDP, revisited post SlideShow 2.1
By Correspondent Marc
One result of the slide show's re-release was to send me off spending a whole lot more time than I had intended, or wanted, looking at the lab reports in the Landis documents.
TBV note: There's nothing stunning here.
Marc finds some things that are curious,
but after discussion, don't appear to be
earth-shattering. I suggest taking it as
a lesson in navigating the LDP to look for
something given a few pointers. Marc
here starts from leads in slide-show 2.1.
Marc finds some things that are curious,
but after discussion, don't appear to be
earth-shattering. I suggest taking it as
a lesson in navigating the LDP to look for
something given a few pointers. Marc
here starts from leads in slide-show 2.1.
(You can click page images to get the original scan)
We've often agreed in this blog that the best Landis defense would come from some scientific challenge to the lab results. Reading the discussion over at DPF, though, I'm less optimistic that that can occur successfully. The debate is now focussing on where the threshholds should be set, and there doesn't seem to be consensus about that. The slide show makes various assertions as to where they should be, but there's considerable disagreement about how authoritative those assertions are.
In that context, arguments regarding the consistency of the lab findings become serious matters and not just quibbles, I think. We expect scientific results to be repeatable: same sample, same results, even if by different routes, at least in most cases. In that regard, the slide show raises some very serious questions, to which I'd like to add a little detail.
Before starting, let me warn everyone that even here nothing is entirely straightforward. The original sample (the A sample) was subjected to a fairly extensive battery of tests, for each of which a different preparation regimen was to be followed. Thus, broken into its many little aliquots and prepared for the different tests, as I understand it the single source becomes a whole range of differing samples. I suppose that means that the absolute readings of the various steroids might be different from one aliquot and test to another. But at the same time, it seems to me that the sainted T/E ratio ought to remain the same (or near enough) regardless.
A really pointed example of what look to me like significant inconsistencies in the results can be found in the three tests reported on USADA 054 (a screening test), USADA 212, and USADA 214 (the latter two confirmation tests). In fact, all three tests were run on the same day--Saturday, 7/22--by the same individual. Their results vary widely. The episode of these three tests is to me a microcosm of the general behavior of the lab.
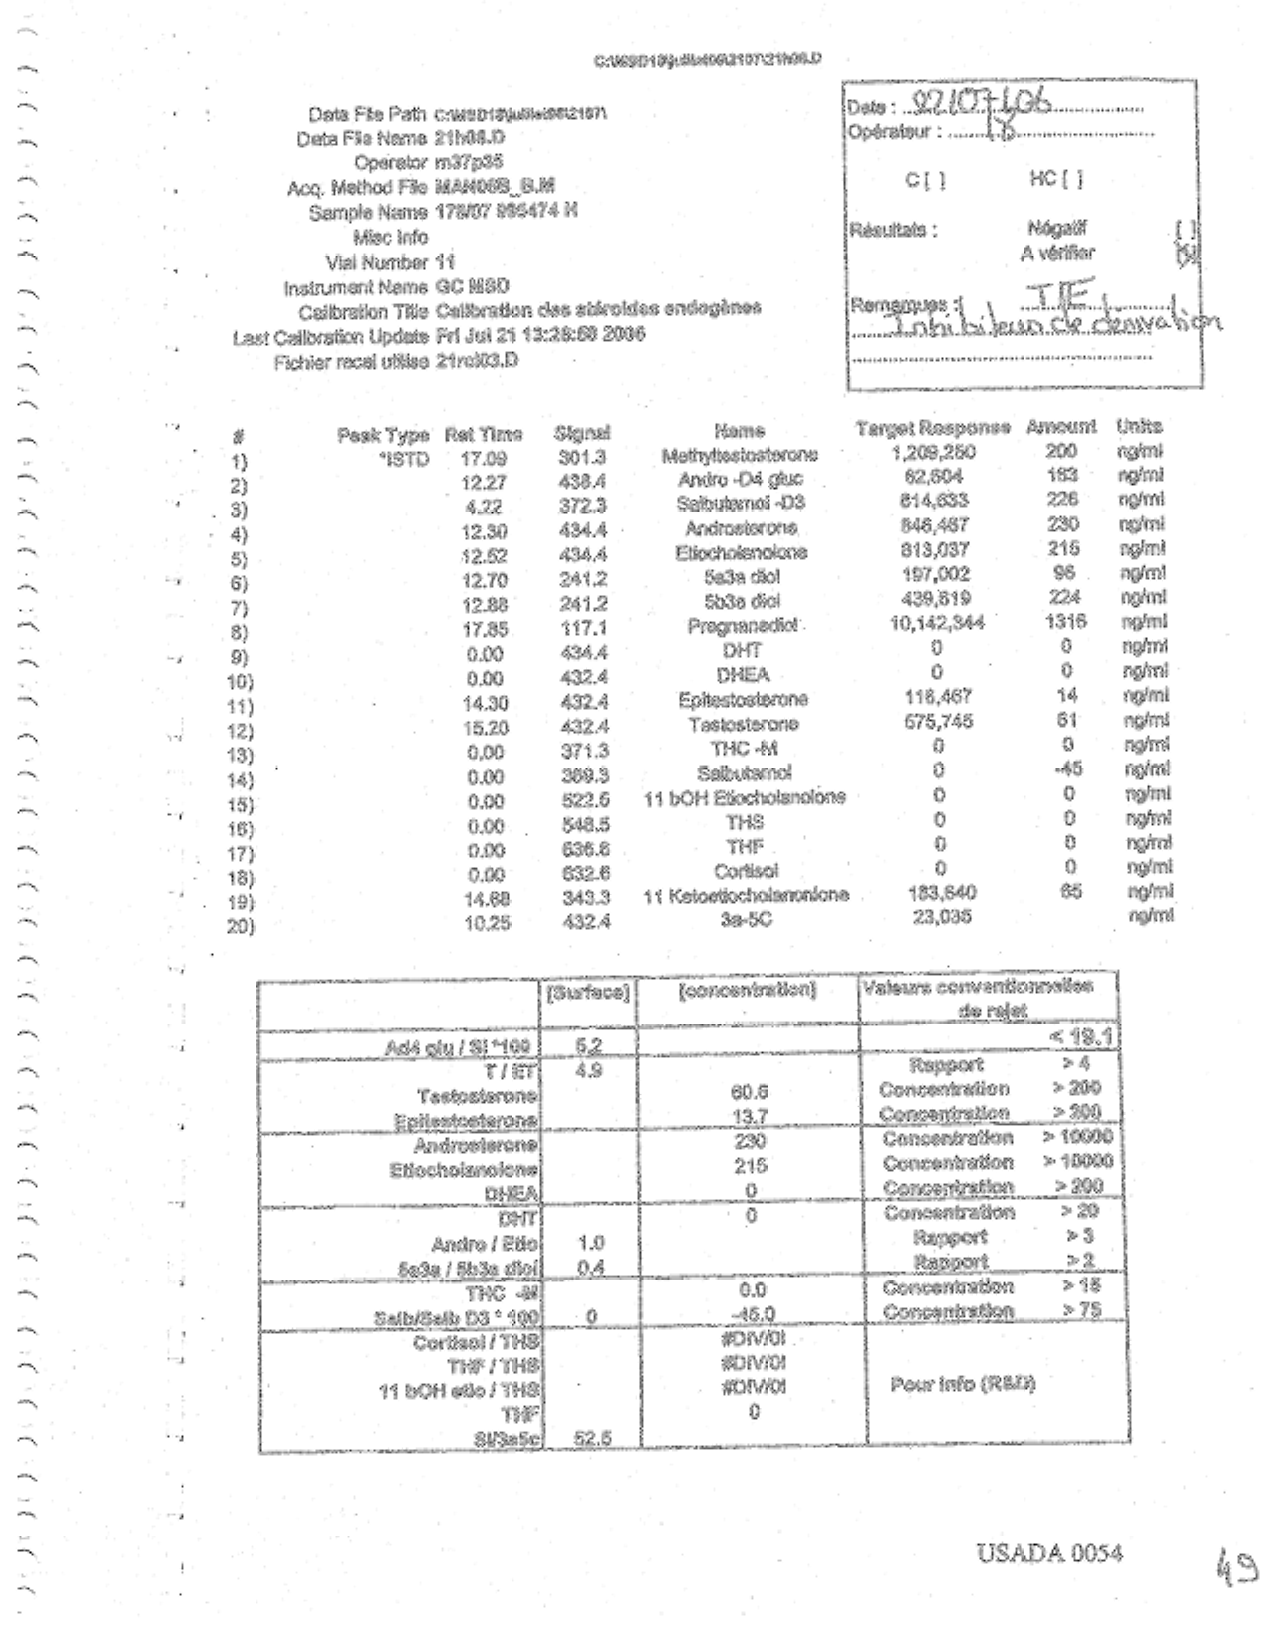 Presumably, the test on p. 0054--the screening test--was performed first. It reports back a T/E ratio of 4.9. Had that been all, would the lab really have gone forward with all the rest of this pursuit? But the operator signals a "derivation inhibition," and checks the "Verify" box on the form. There is no explanation as to what led to this conclusion. (See below, by the way.)
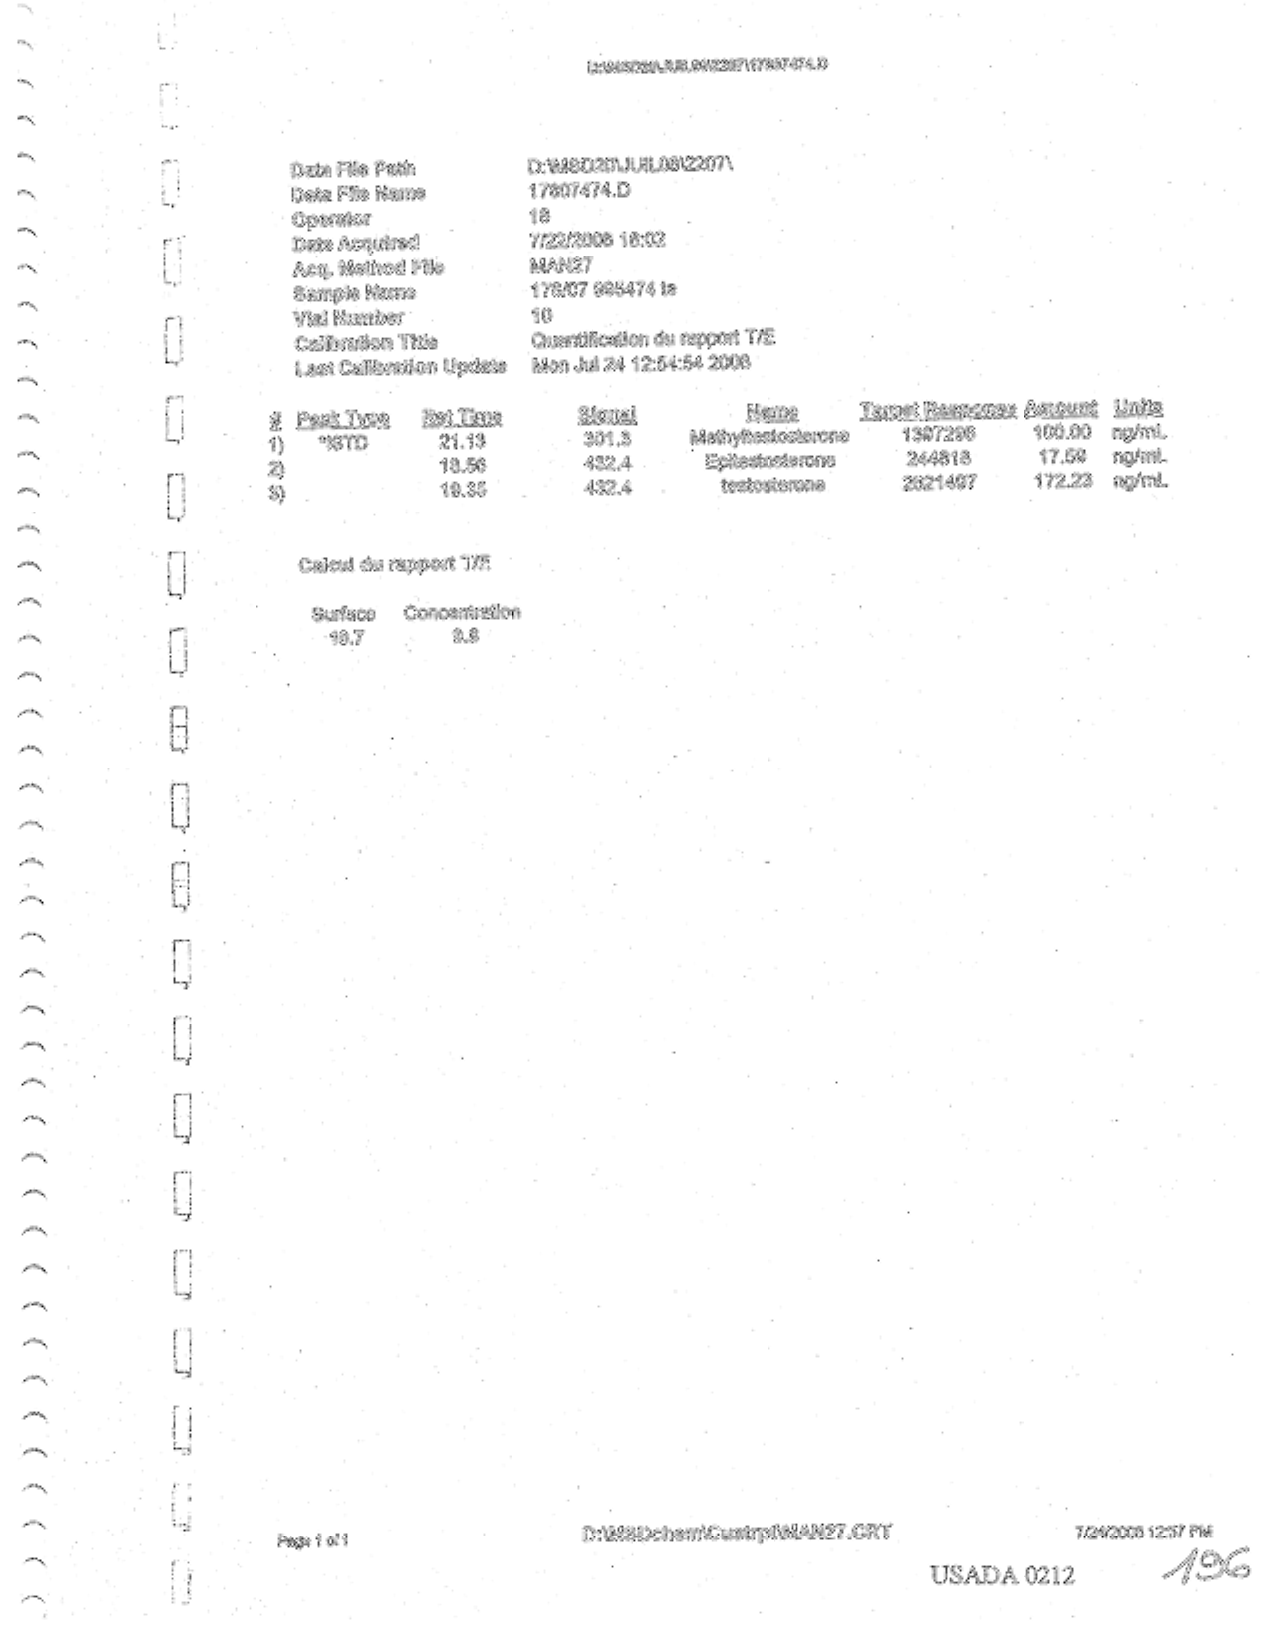
At this point, I imagine,the tests on p. 0212 and p. 0214 were performed. Their results are altogether different from 0054's, both in regard to absolute values for T and E and the T/E ratio. Now, on the one hand, their absolute results might be different from 0054's because they were performing a different test from 0054, and needed a different preparation. But on the other hand, the results on 0212 and 0214 don't agree with each other in regard to the absolute values of T and E, even though they were performing the same test.
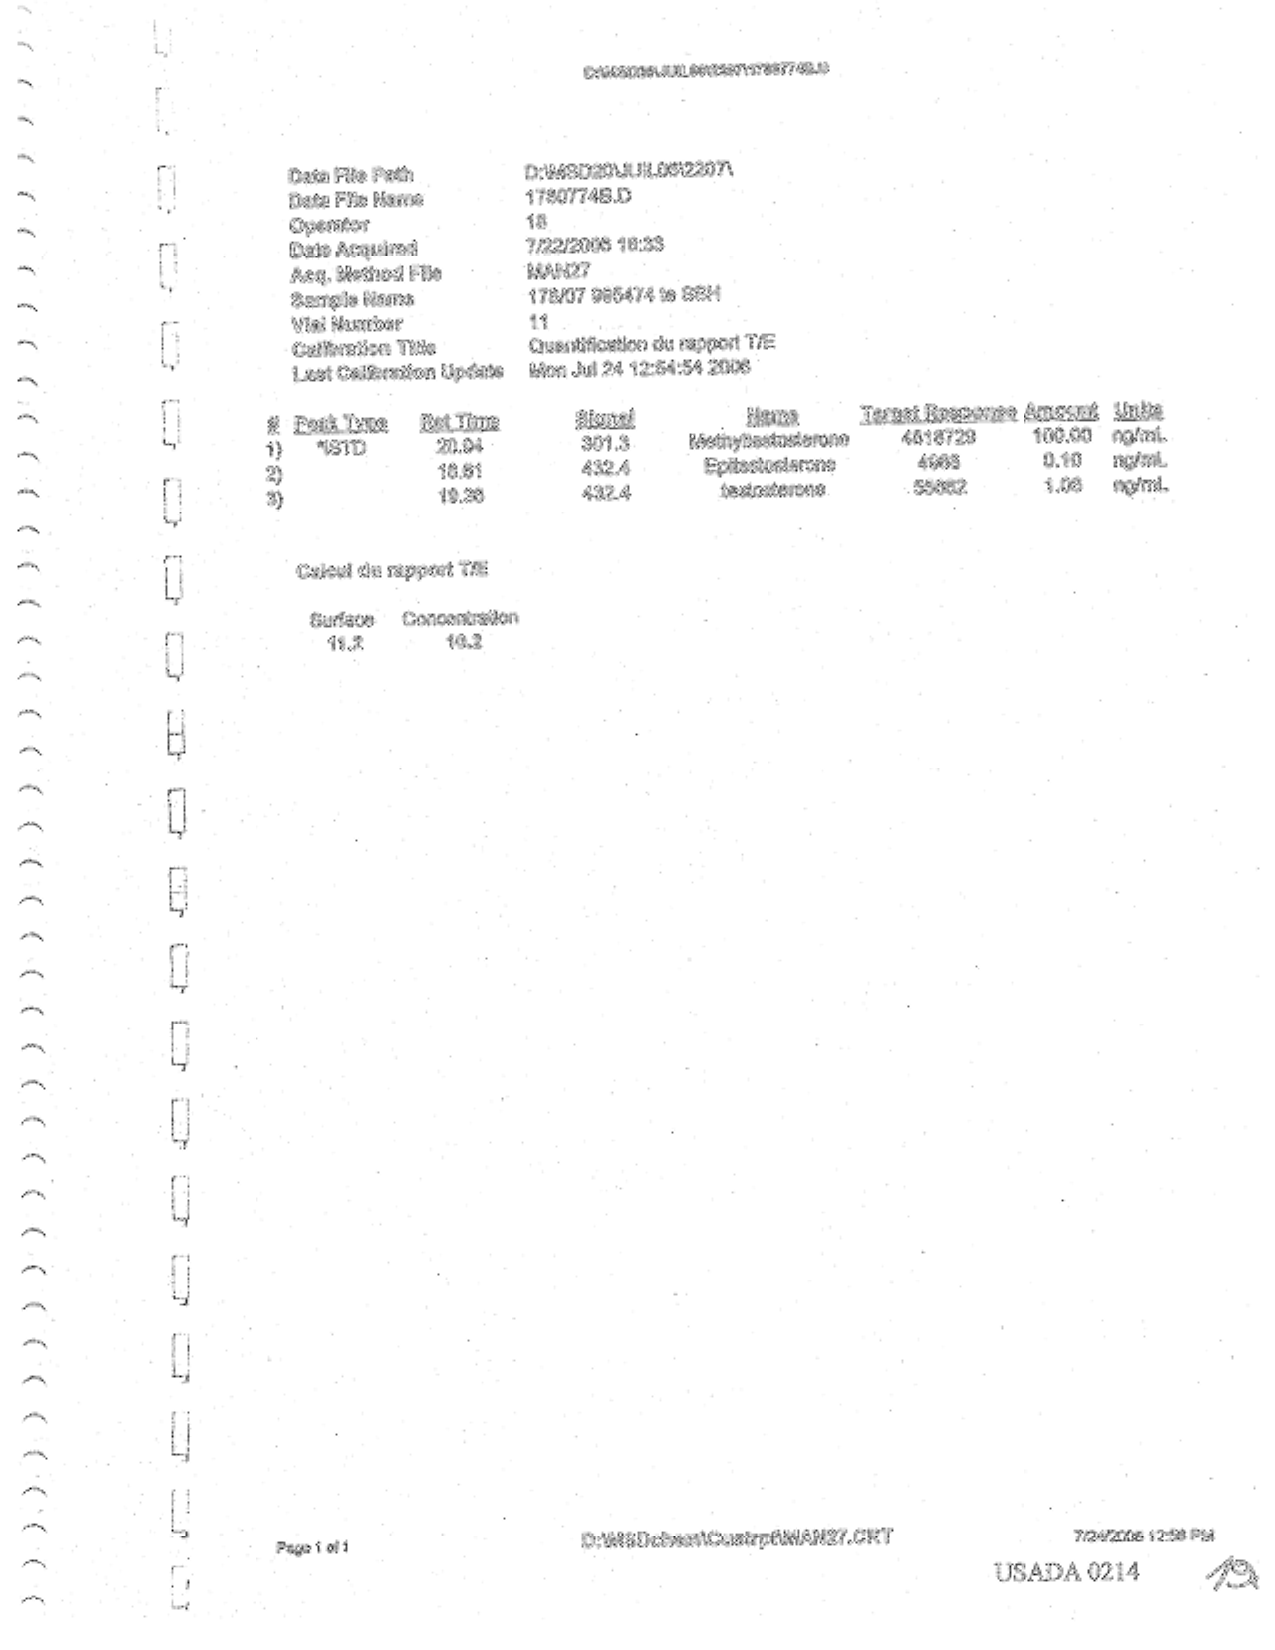
(Here again, there might be an obscure explanation. 0212 and 0214 may be using different samples. 0212's is identified as "995474te" while 0214's is "995474te SSH." But I wonder whether these really are different samples, and even if they were, I would want it confirmed that this accounted for their different results. I warned you that nothing was straightforward.)
In any case, 0212 and 0214 don't exactly agree with each other on the T/E ratio, either, though they are closer to each other, and far removed from 0054. 0054 reported 4.9, 0212 reported 10.7, and 0214 11.2. But all of that variation, coming with the same operator, on the same day, does not exactly foster confidence in the solid scientific underpinnings of the results.
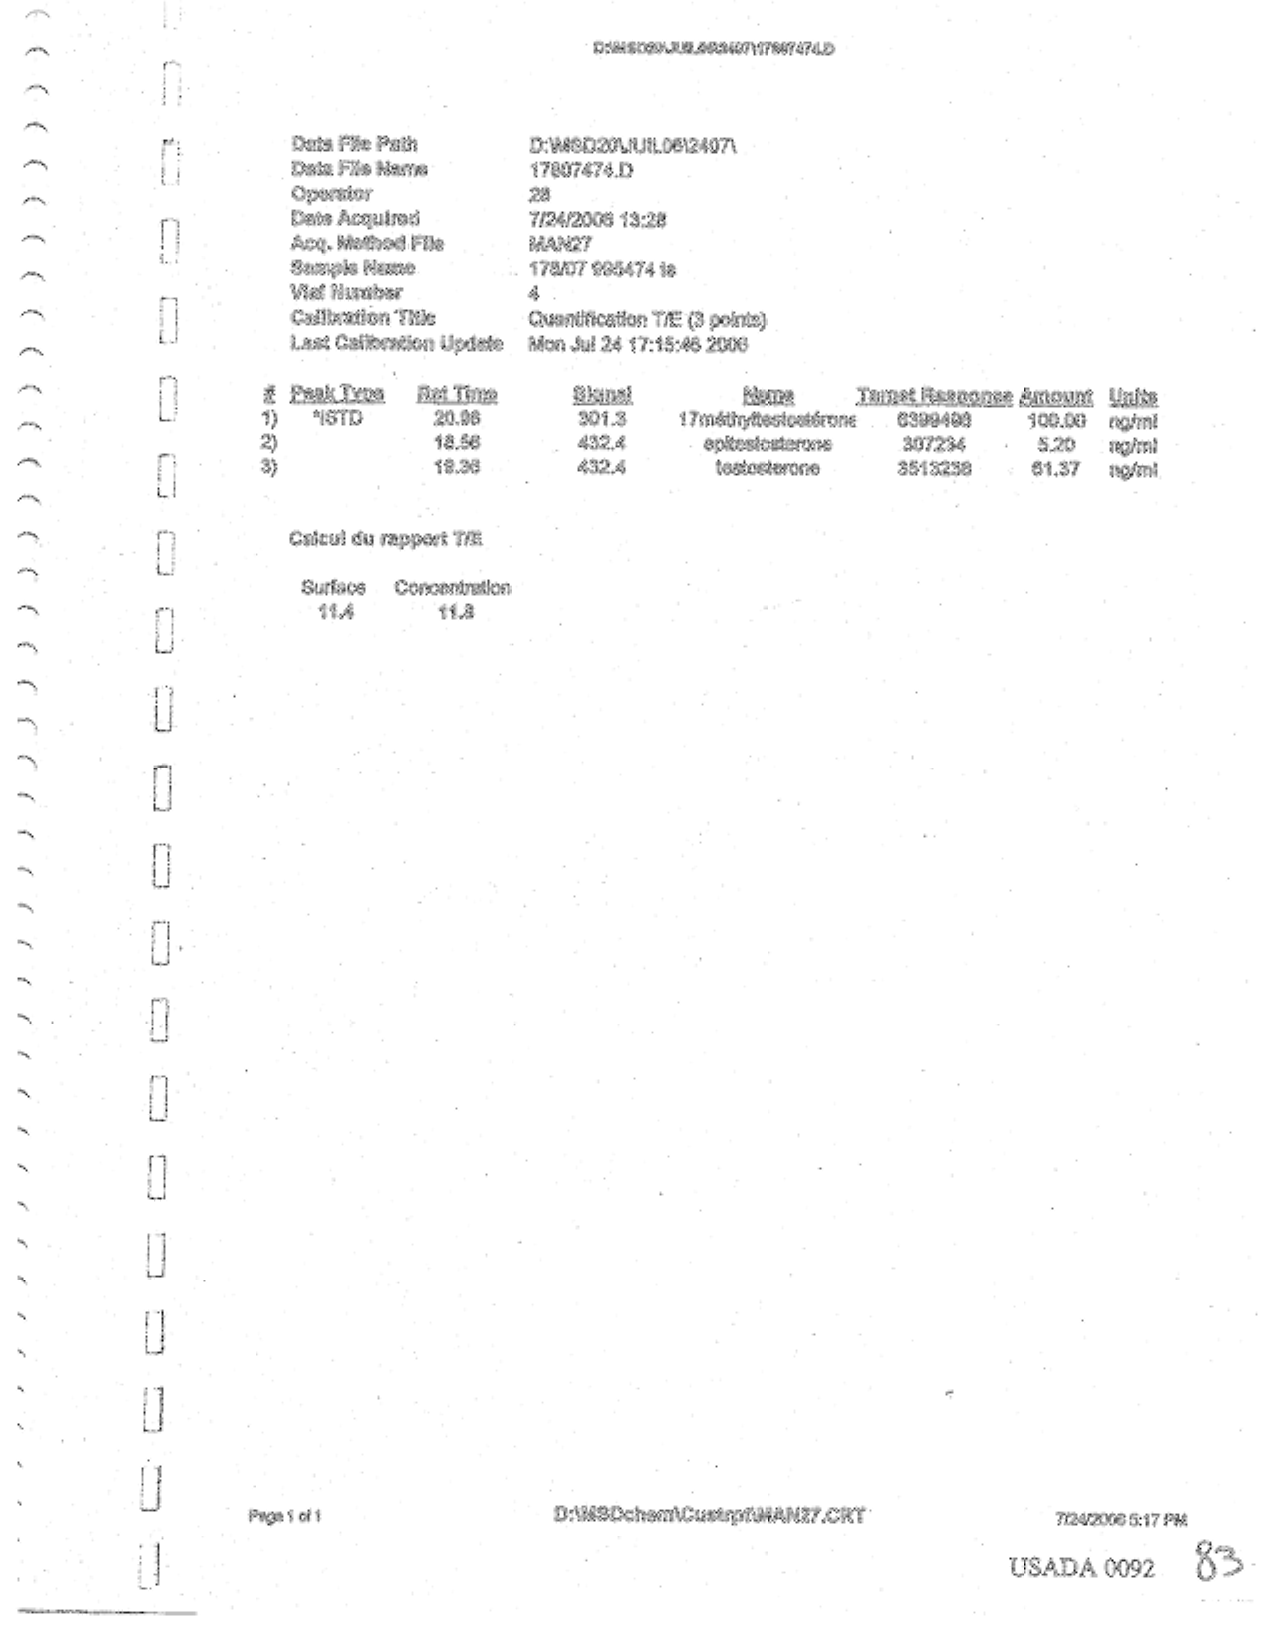
(There are two interesting sidebars to this day's tangled story. First, when it came to writing up the T/E ratio results, LNDD used neither of these tests in its report on USADA 101. It uses a test from a 7/24, on p. 0092.
Second, the same test performed on 0054 was repeated on 7/25, apparently using the identical sample (995474H) despite the dread "derivation inhibition." Its results are reported on p. 0057.
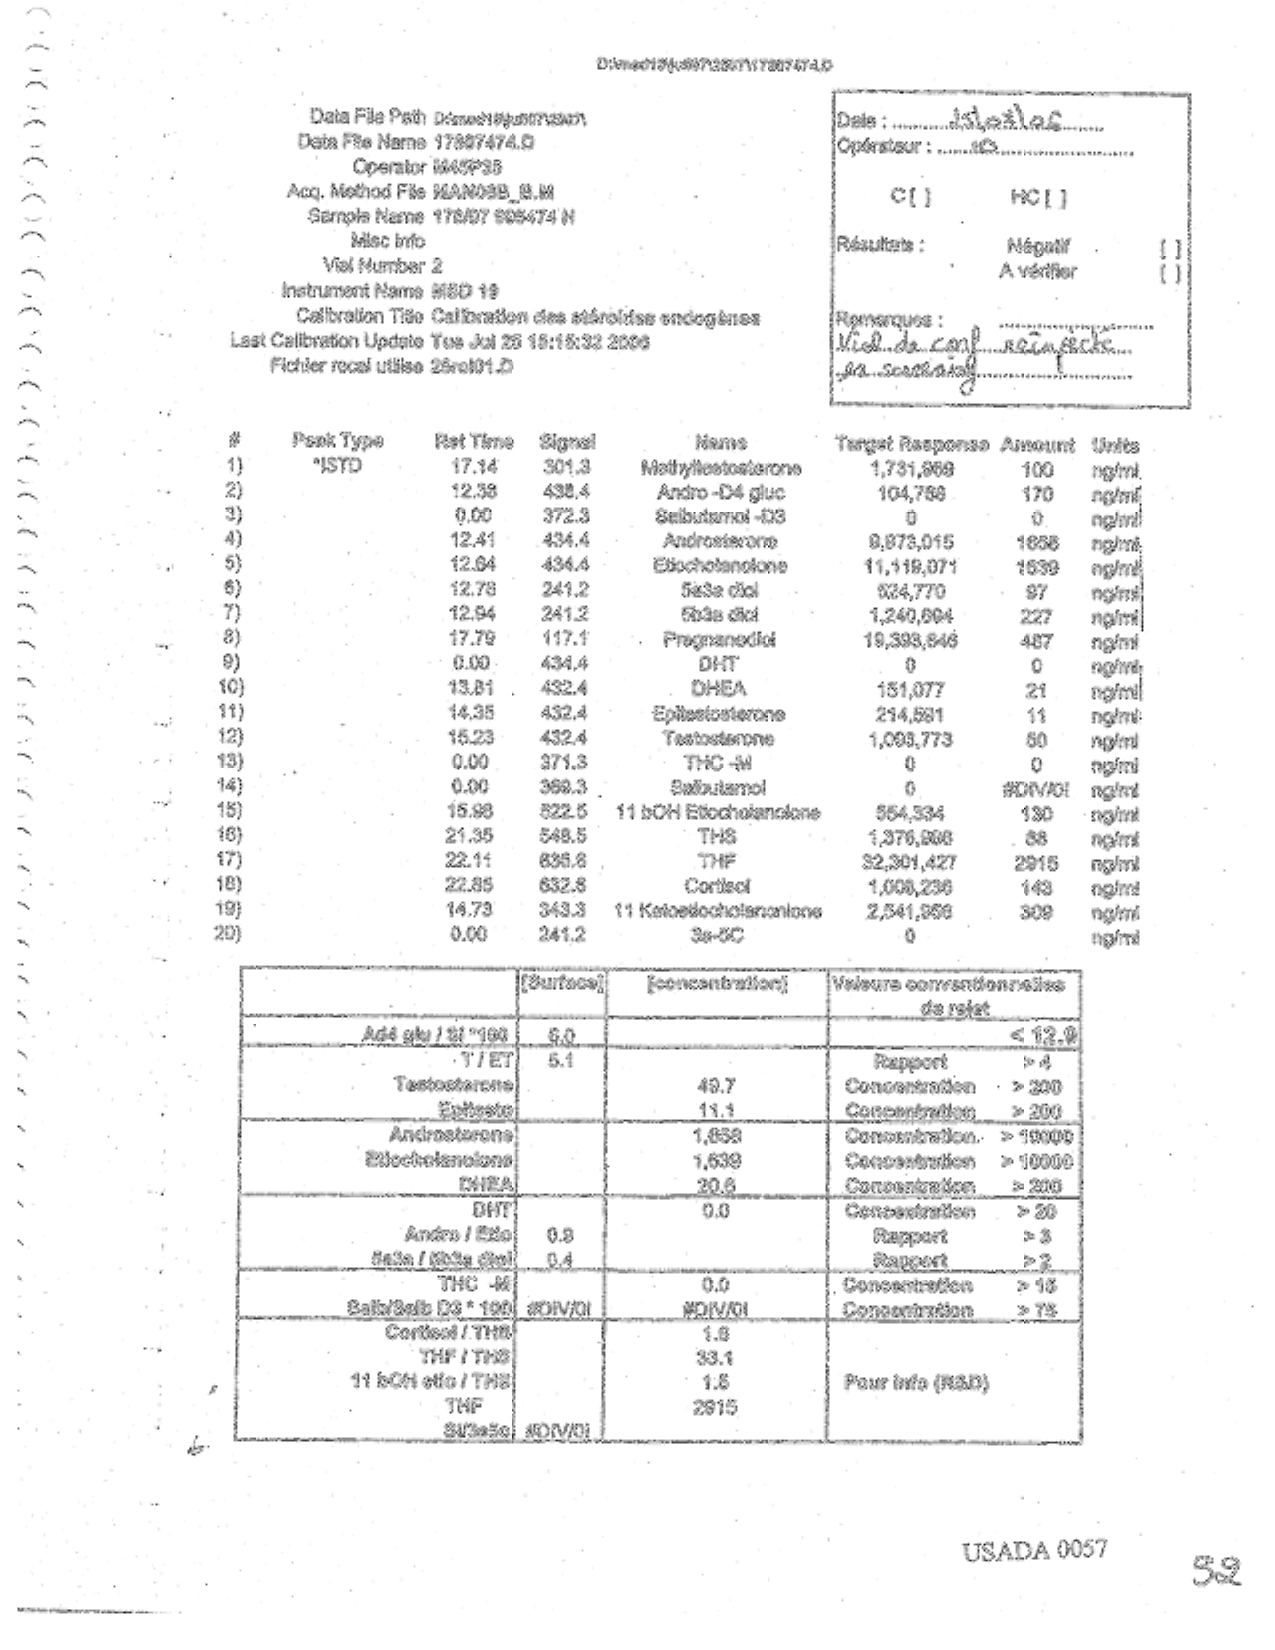 The absolute results for the various steroids are completely different from 0054's. There's that fine scientific repeatability again. The T/E ratio, however, is very similar: 5.1. Go figure. The new operator notes: "Confirmation vial reinjected in screening." What in the world does that mean?)
Perhaps someone with experience of these tests can explain why such widely and, if I can use the term, "consistently" divergent results are normal and do not signal serious scientific failures. But no one has bothered to do so yet, and until someone does, I am looking wirh increasing skepticism at the pronouncements from the "authorities.”
[end]

12 comments:
I'd be interested to see what Rational Head from the DPF would respond to your questions here. Did you kick this over to him?
Fair enough, Kevin. I've posted over there--with a reference back here--so we'll see if he (or others from there) set me straight.
Marc
It sure makes a person wonder if the French lab was objective and simply testing samples and recording results. Why so many tests? We're all tired of conspiracy theories. But so much of this story seems like someone decided that Floyd is guilty and turned "every which way but loose" to try to prove his guilt.
Please don't go into conspiracy land. It's paranoid and non-productive. This isn't an unreasonable number of tests to run. The questions are about their correctness and consistency.
TBV
One thing about the variation in the T/E results for the A sample. If the urine is a uniform mixture, meaning that the components are evenly dispersed throughout the liquid, then the results should be fairly uniform. That is, if you divide the sample into 100 or 1000 aliquots and analyze each for the T/E ratio, then all the values you get should fall within the margin of error centered around a particular value. So if you get results that range between 4.9 and 5.1 with a large number of readings of 5.0 and the margin of error is +/- 0.2, then the results are all OK and the test results are OK. But with the results of Landis' A sample, you get a very wide variation. That suggests one of two things:
- The components of the liquid are not evenly dispersed throughout the liquid, or
- The test methods themselves can't produce reproducible results, which suggests that the test itself is unreliable
In either case, you can't draw any conclusions about what the true value for the T/E ratio is. In the first instance, if the components are not evenly distributed throughout the liquid, there's no way to determine the actual concentrations. In the second instance, the test is unreliable, and again you can't draw any conclusions about the concentrations.
An emailer writes,
it has been my understanding that the reason why there is a 4.9 T/E
and then a couple of T/E's in the 11 range is that the 4.9 is a result
of the screening test which is a fast, inexpensive test. If that test
is over the limit, a more precise, more expensive test is run to verify
the result.
I've used this very argument before, but the last time I did, I found myself wondering why are the values so very different? Is this variance normal?
TBV
TBV,
Well, if this were the case, then I'm still surprised by the magnitude of the difference. It's more than double the screening test.
If the more accurate test consistently turns up this kind of difference from the values of the intitial screening test, then the initial screening test isn't very good, because an initial result of 2 would show up as greater than 4, (i.e. positive) on the more accurate test. Anyone between 2 and 4 on the initial screening would be escaping the further analysis required if the other, more accurate test had been run.
I can believe there could be a quick screening test, but the magnitude of the difference in results between the two seems to be too much. I would expect the 5.1 result to come back within +/- 10 or 20 percent on the more accurate result. Something's not right about that much variance.
- Rant
I agree the discrepency is suspicious. In these things, I usually try to think how the ADA side would argue each point to make sure the claim is sound.
In this case, enough people have waved away "screen" vs. "confirm" test differences that I think either the defense needs to make the case clearly that they ought to be closer, or give up the claim that it is meaningful. I think, using the word of the week, that its a little disingenuous to yell about the difference with no discussion of the screen vs. confirmation distinction.
You know the ADA side will seize on that as a bad argument, and discredit it unless expanded.
TBV
TBV,
I'm sure you're right that the ADA side will do just what you say. I guess the thing that needs to be determined is whether two different types of tests were actually performed, or whether the same test was performed to validate the initial results.
Gonna have to go back to the documents and see if there's any notations on that. However, it wouldn't surprise me too much if LNDD would make that argument anyway. They haven't revealed much about their testing procedures, so I could very easily picture them claiming the initial result was from a crude test, and the other result was from a more accurate test.
Of course, that argument raises some interesting questions about how many positives might be getting away from them if the initial test is so crude that it produces a result less than half of the actual value.
- Rant
TBV,
Indeed, there was a rapid test performed to determine the initial T/E value for the A sample and a different test to confirm.
How there could be such an extreme variance in the results still puzzles me.
- Rant
Sorry to be slow in responding. Time zone issue: I've been out to a concert and then dinner. Dirty work, but. . . .
There have been a number of answers to my post on the Baker's Slide Show 2 thread over on DPF, some on the thread, some in PMs to me. Jimmy there has been particularly kind in going over old ground with me. I'm not going to do justice to the detailed aspects of his answers to me, but his defense (if that's the right term) of the lab work has essentially three facets:
(1) There are major differences between the screening tests and the confirmation tests. The screening tests are not "hydrolised" (I think Jimmy is an Aussie, hence the spelling), the confirmation tests are. Non-hydrolized tests (back to US spelling) have a high "signal-to-noise" ratio, so they're just used for a quick indication of whether there's a problem. Hydrolized tests are more reliable, but the raw numbers change substantially because of the hydrolizing.
(2) The screening tests are "notoriously" less accurate, so one shouldn't put too much faith in them, nor should one be surprised if they vary a lot one from another (as 54 and 57 do, for instance).
(3) In the confirmation tests, the samples are sometimes enhanced by a "doping each sample with an internal standard (Methyltestosterone). This way variation with the volume of sample that is injected into the GC can be normalised by comparing the peak size of the internal reference." In one case he thought that using the wrong amount of the "internal reference" had led to substantially different raw numbers. But he asserts that "the error is internally correcting since the interest is in the T/E ratio which . . . remains more or less unchanged. . . . The concentration isn't actually important for T/E - you don't even need a concentration at all just the peak sizes and the calibration of the relative response (i.e. you know how to relate them). In fact you don't need an internal reference either - you could just use the raw peak sizes to get the surface T/E - the WADA docs say all this too."
I get the point of #3, and if it really is true right down the line it renders any "inconsistency" defense irrelevant. But I asked Jimmy how to account for the pair of tests 97 and 212 (or 101 and 223 in their final form) where the raw values were widely differing even though the tests were the same, the dilutions were the same, and no machine information was given to account for different sensitivitiies. To that he could give no answer, though I think the defense would fall back on saying "it's the ratio of the peaks that matter; don't look at the absolute numbers."
I accept expertise. But I remain nervous in general about any scientific situation where the same sample (presumably) gives different results in two different runs of the same test. And here especially, where the diligence of the lab in keeping the samples unconfused and uncontaminated is one of the key issues, I really want a concrete explanation of how such an event could occur innocently.
Also over at DPF, duckstrap has sent me a link to:
http://landiscase.wikispaces.com/
where down the left-hand column are a whole set of basic science links. I'll guess I'll go read them. I hadn't intended to learn all these details, but I guess if I want an answer, I'm stuck.
Marc
If I understand the technical discussions, the confirmation test only has the potential to be more accurate. The accuracy is dependent upon accurately integrating the responses for all of the target substances and only the target substances.
In the calibration of the confirmation tests, the integration occurs across a 1 mininute interval around a centerpoint (USADA086,USADA270) for E (18.52,18.50) and T (19.32,19.30). If the target substances drift out of that window or other substances drift into that window, the results will be in error.
If you look at the graphs of the T&E windows, it certainly looks like a complete mess compared to the calibrations (lower left USADA093, USADA277, USADA280, USADA282 v.s. USADA091, USADA094, USADA095, USADA096). There are spikes just outside of the T window. Are the earlier spikes T or whatever other substance was just outside of the T window? Are there any E spikes beyond the edge of the window? And of course, the T and E windows actually overlap by about 0.2 minutes. So, those responses actually get counted twice, once for T and once for E.
By comparision, the sreening graphs look simple (2nd row from bottom, middle USADA055, USADA058) and similar to the calibrations (USADA052,USADA061).
I have no expertise in this field, but this is my understanding based upon the information exchange that has been occuring.
Post a Comment